


Class 14 Valuation: Valuing the market & young companies
Paradigm shifts & lessons learned on valuing Amazon.com as a young company


When you value a listed company, the valuation result is always different from the share price. The is due to:
you are right & market is wrong
you are wrong & market is right
both you & market are wrong
both you & market are right
None of the above
Answer lies somewhere in option 2 & 3 above, more towards 3. Imagine a Yelp review on a restaurant vs. your given review. An aggregate review may not necessarily be the right review. Your review may be way off from the aggregate review too.
Why not option 2? It would be the end of valuation if we are always wrong. Might as well do index fund! (Some would argue for this case)
What we want is to hope that we are less wrong than the market. Hope, because we always predicting the future & no one can be perfectly right. We don’t have to be right all the time, but just less wrong most of the time.
Next, how do we account for expected dilution?
A young startup with all the growth projection implicitly means they need to raise capital. There will be dilution in the current outstanding shares.
If the o/s shares today are 10 million & is expected to issue 3 million shares in the future. Do we add on this additional 3 million shares, or a 30% discount to account for dilution?
Answer is no.
The ‘dilution’ already appears in the negative to low FCF in the initial years (and via a higher cost of capital).
A DCF done right already has dilution effect embedded.
// Class 14 begins
Let’s now value a basket of stocks instead of an individual stock - the S&P500. This provides an answer to the perennial question - is the market overvalued or undervalued?
Let’s acknowledge that this is a form of market timing, something not desirable in investing. While we can go deep into a specific company to find insights, it’s impossible to do such analysis for the market. However, let’s learn how to do it anyway because it is often asked.
Estimating Free Cash Flow would be difficult as the market underlying has varying business types. Dividends discounts model is possible as this is a way that company returns cash, but we also need to take into account of shares buybacks that increases share value.
Let’s look at the model below undertaken in Sep 2022 where inflation is a big shock:

There are analysts that project index earnings (aggregate of underlying companies’ earnings). So, 1st question to ask is have analysts incorporated inflation effect into earnings, which would reduce expected earnings?
Next, what or how inflation would do to the discount rate. Higher?
Basically, are earnings being forecasted by analysts over-optimistic due to impending inflation?
Also, how company reacts to an inflationary environment where they will be less optimistic in returning cash to shareholders.
Below are the projections given by analysts, in index units from the base of 208.5 in last 12 months (of 2021):
2022: 225.3
2023: 243.5 (+8%)
This projection is derived from the following assumptions as depicted in the diagram above:
Earnings growth of 6.7% p.a. for next 5 years
90.9% of cash returned to shareholders by dividends or share buybacks
Are those numbers too high/optimistic? Prof tracks analysts’ estimates from January 2022 to September 2022.
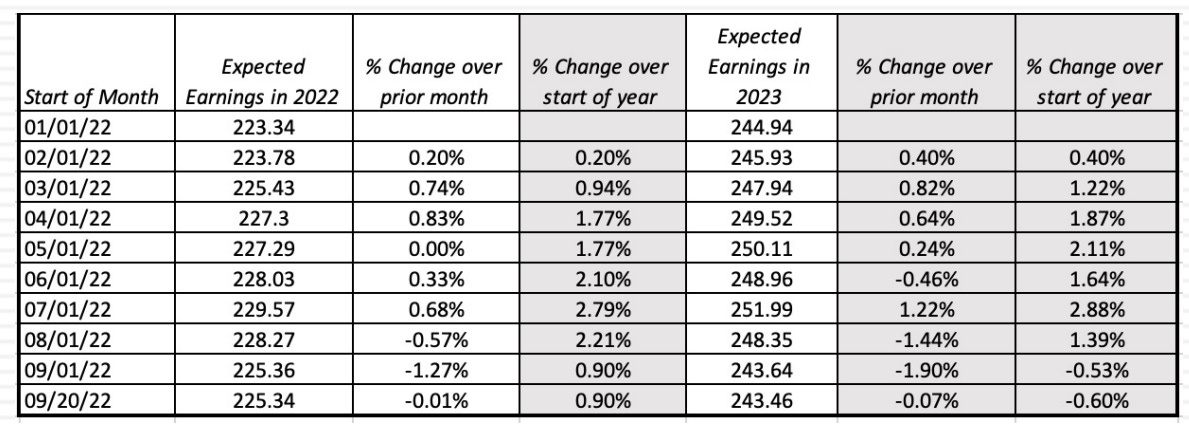
From the % changes either month-over-month or against January, it looks minimal, as if inflation is not happening.
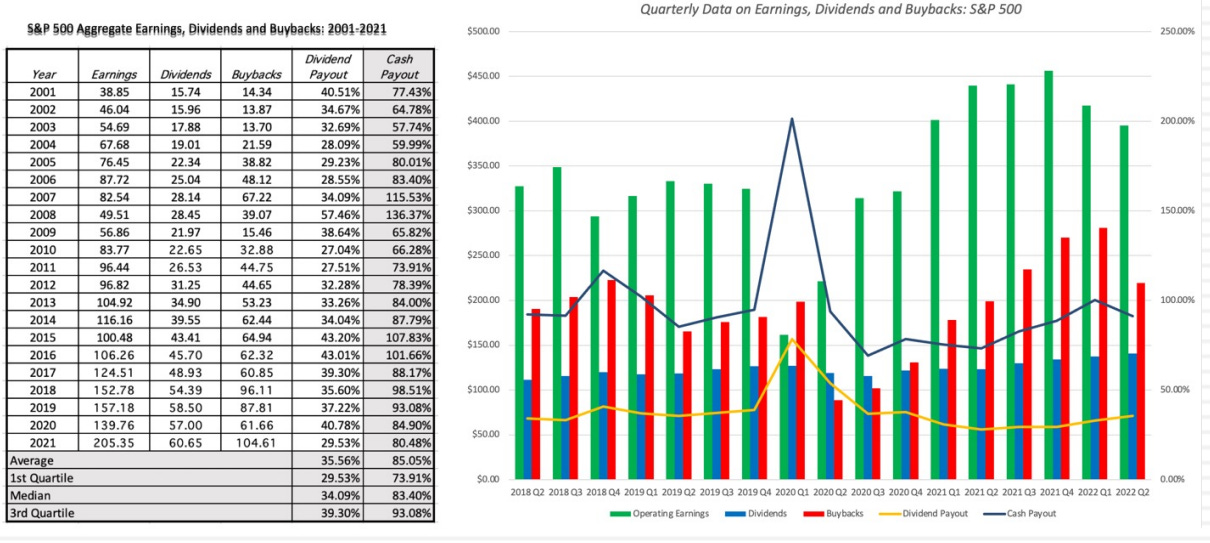
Then, we look at cash returns by dividends & share buybacks.
In total on average for 20 years since 2001 to 2021, average is 85% of earnings being ‘returned’ (via dividends or buybacks) back to shareholders.
Prof’s S&P500 story
Emphasis that this is prof’s story. In Sep 2022, prof opines that analysts have underestimated the impact of recession on expected earnings. Hence, prof
Reduced 2023 estimates by 15%
Cash returns reduced to 80% from 90.5% of earnings due to uncertainty
Unchanged to discount rate as bulk of rates hike have already happened
ERP of 5% unchanged as this is close to historical ERP

The result shows that the current index is 4.8% overvalue. It also means that analysts are too optimistic in their estimates. A sensitivity analysis is done on the above assumptions by prof to answer all the What Ifs:

Dark Side of Valuation
This was the title of 1 of prof’s book. Anyone can value a stable, money-making company but what about valuing young companies where business model is still in pivot?
4 questions to ask:
What are cashflows from existing assets? Easiest to answer even if the answer is none esp. for a young company.
Growth has a good side & bad side, what is the value added or destroyed by growth (yes it happens)? Hardest to answer as you would need to study the business & the industry.
How risky are the cash flows from existing or growth assets? Nothing about beta or CAPM but along the same thinking (i.e. cyclical or defensive?)
When would the company become mature? This is the closure to the narrative.
If every company is like ConEd, a stable utility company with long history, you then don’t need to learn or do valuation. It’s mechanical & can be done efficiently by AI or machine much better than us.
This is where the dark side comes in, the difficult company, the young company, or company that is at the risk of being bankrupt is where your valuing skills is worth more.
Prof will share valuation across the lifecycle, from young to mature & from mature to declining companies. Negative revenue growth, declining margin, etc.
Then there’s also valuing across different markets. Intricacies like cross holding, regulatory & government interference becomes a challenge.
There are also different sectors or vehicles. SPACs, banks & commodities/cyclical firms.
The challenge with young companies
What’s more challenging about young companies is that all of them looks the same!
All are losing money
All with small revenue
This is why pricing is practiced by VC, and not valuation.
When we value, we normally draw information from 3 sources:
past historical numbers from last 10K or annual report
then on industry benchmarks or averages
Young companies have no history, no averages & no comparable. This is where the dark side comes in, i.e. Valuation doesn’t matter in [AI/EV] (or pick a current hot trend)?
Valuation always matters! When you can’t value something doesn’t mean it doesn’t matter.
When you can’t value, you use words like Paradigm Shift where prof has witnessed 5 Paradigm Shifts that didn’t shift or rather shifted back to normality.
In 1999, there will never be a recession again because technology solved it
When you talked about a company, that talked about the macro trend as if the company doesn’t matter. e.g. Rivian/Tesla vs EVs. Snowflake/Palantir vs Cloud Computing. This is best illustrated in any Cathy Wood interview, every company is backed by a macro story.
Macro story is not wrong but only half complete as the company will still need to prove how it will benefit from it. When Alibaba went public in 2014, Prof used the “China Story” to value the IPO. Prof explained in detail how the China Story affects the valuation he did for Alibaba, which was rather high at that time at ~$150 billion.
Prof got interviewed by CNBC with another analyst which gave Alibaba a value that is twice as much. When prof asked him how, he just answered - “China”. Prof’s entire $150 billion was entirely from China, but how to justify 2 different vast valuations? There’s another China twice as big?
This is the dark side of valuation, using macro to justify valuation where there’s no upperbound limit.
Then New Metrics are created because conventional metrics like P/E won’t work due to losses.
Market Value / Eyeball for websites evaluation, anyone?
If you are asked to purchase a company that is worth 5,000x P/E, would you buy? No, because it sounds high & you would have some sense of reference as a typical P/E is ~20x.
5x P/Revenue? Sounds high because there’s also a frame of reference with a typical 1x-2x.
How about 5000x P/impression or clicks? You have no idea how to frame this. Which means, it can sound expensive, or very cheap!
Per Subscriber, Per Download, Per GTV, Per GMV etc. This is where the Dark Side comes in, again.
The original Amazon valuation
Many years back in late 90s, someone asked if Prof can value Amazon (still a money losing company back then) using DCF sarcastically.
Prof answered Yes & this person replied sarcastically again, “of course, academically”. Meaning, valuing young companies has no real-world use.
This is when Prof took the challenge & also kept a journal on the roadblocks he encountered where conventional valuation literatures don’t work on young startup companies.
By the time the valuation is done, the journal is 70+ pages long which became prof’s 1st edition of the book. (His recent 2018 blog post about this.)
In Jan 2000, the peak of dotcom boom where Amazon is the poster child. Following is the DCF done:

Step by step:
At that time, Amazon was doing $1.1 billion in revenue, which is tiny vs a conventional retail business that is 50x-100x more. EBIT was negative $410m.
This is a classic startup with small revenue & big losses.
A basic assumption for any businesses is that it will grow from small revenue to big revenue, which will reduce the losses & turns into profits. What you need is then a target margin too on top of revenue growth assumption.
Prof assumed a revenue CAGR of 42% & yet they are people who called him pessimistic! This was due to anchoring bias as Amazon just had a 200% revenue growth.
As you looked into the annual revenue growth, it actually scales down. From 150% year 1, to 100% year 2, 50% year 4, until only 6% in final year 10.
Over time, prof assumes that margin will converge to 10%, which was the 70th percentile of all (non-online) retail companies’ operating margin in 2000.
Pessimism again by naysayers why only 10% when the business model is online with lower fixed costs, etc. Prof argues that if margin is any higher, all brick & mortar stores will just close shop & do online, which will bring margins back down due to competition.
In fact, it is inevitable that online shopping will grow which will compress margins. What Prof did, in maintaining margins fixed is more optimistic rather than pessimistic.
Next, to grow revenue 10x requires reinvestment.
The academic way of estimating reinvestment is via ROIC, which is impossible in Amazon due to losses.
Revisiting previous growth rates & reinvestment notes (I & II).
Hence, sales-to-investment ratio is born (Sales Turnover). Prof assumed 3x as a benchmark he gathered from brick & mortar retailers. i.e. For every $3 of sales generated, $1 is used for reinvestment.
Again, naysayers argued that there’s no need for store fronts, hence the turnover should be lower. Prof answers while there’s no need for outlets, there’s need for servers or even acquisitions (which is very normal in online business model).
In this most upbeat narrative that prof has given, FCF actually is in negative for the 1st 6 years of projection.
This is not a surprise. In fact, the more upbeat you are at the company, the more reinvestment you need to make upfront which reduces FCF!
Next, is to estimate the costs of capital. Not a single number, but a multiple variate of costs of capital as we’re estimating a growing company where risks will reduce.
In Amazon case, prof starts with 12.8% & ends with 9.6%.
Discounting the FCF of 10 years gives you $15.17 billion, adding on with the terminal value of $52.15 billion.
Big portion of the value is in terminal because this is the feature of young companies, that there’s nothing much from operating assets but in capital appreciation very much later.
Options are substracted out, amounting to $2.9 billion.
Dividing by # of outstanding shares give Amazon a value of $35, while it was trading at $84.
After valuing, action must be taken! Since the value is lower than the price, should Prof short it? Not in this lifetime!
Why, first is to understand the reverse. If price is lower than the value, prof would buy, and would hold it for as long as it takes.
However, in shorting, there’s a timeframe as you’re borrowing the stock from the broker. The timeframe was only 6 weeks!
Not only must prof be right, but he must be right within the 6 weeks.
This is the biggest assymetry in the stock market.
When something is undervalued, you can buy hold and wait. But if is overvalued, there’s no long term strategy (that is available to the masses). In some parts of the world, you can’t even sell short.
Wrapping up in 4 lessons
In valuing Amazon, prof now shares 4 valuable lessons he learned.
Lesson 1: Don’t sweat the small stuff
When you are valuing a young company, forget about Beta via regression. When prof extracted the Beta via Bloomberg back in Jan 2000. The raw beta for Amazon was 2.23, with a standard error of 0.5. Meaning beta can go from 1.7 to 2.7!
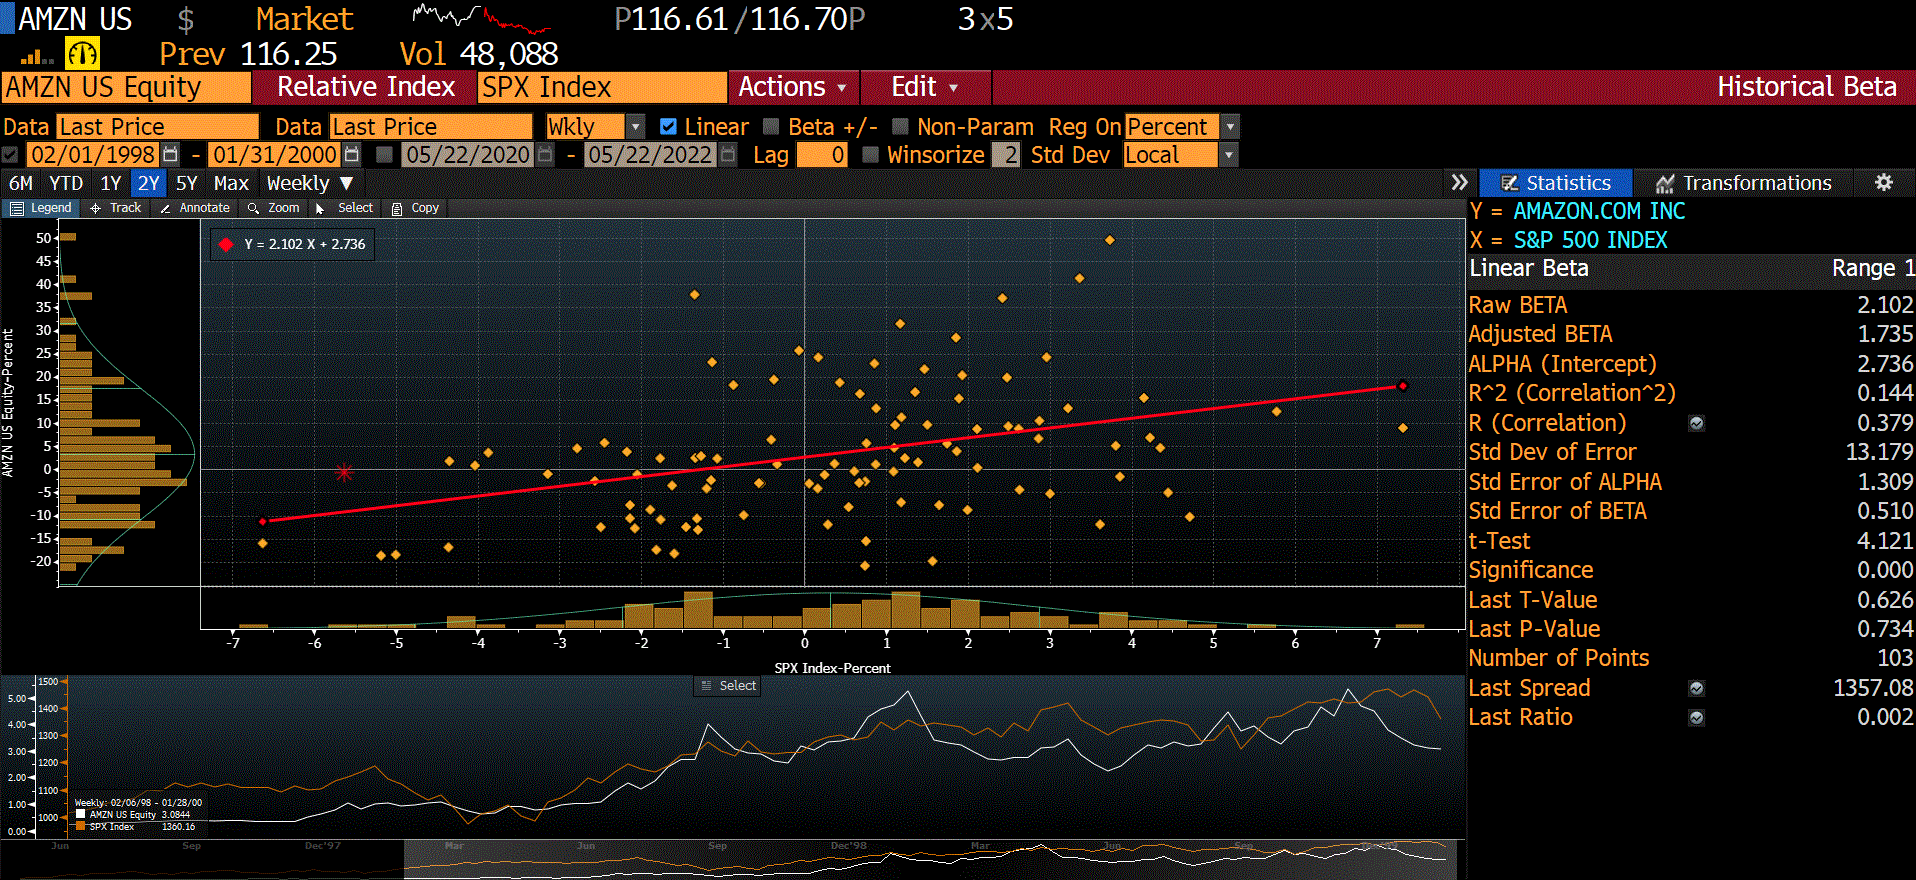
Focus on the business itself & use the beta of such business. Or it can be bottom-up calculated but also keep in mind beta changes over time esp for young companies. For Amazon, first prof was using online retailers’ beta which derived 1.6 then next a beta of 1.0 for normal retailers as the company grows. From beta alone, it can be deduce that the risk (or to be precise price fluctation agaisn’t the market) stabilise to close to the market volatility over time.
Lesson 2: Work backwards & keep it simple
Back to revenue CAGR of 42% that prof derived. Rather than doing it sequentially in projecting year 1, year 2 & year 3 growth. Prof imagine what the company would be like in 10 years if it succeed. That's the story prof wants.
A successful Amazon means it would be a successful retail company. Back then in 2000, Walmart was doing a $100 billion revenue. Prof scan through all retailers, from discounted retailers like Walmart, to niche fashion retailer like Gap. That’s how he comes out with $40 billion. A number that lies in between.
All the annual growth rate? He just made them up as this is not the goal. The most important point is that the company will grow to $40 billion to year 10. The annual growth rate is just a means to the end, in a sensible way.
This is why prof is furious about young companies fixated on quarterly EPS. Is the same as looking at a child’s kindergarten report card & predicts that he will never go to college. That’s a bit of over reaction!
Same goes with margins, just purely by using Excel in getting the difference between Year 1 margin to Year 10 margin (what a normal retailer margin would look) and uses a incremental margin to reach the Year 10 margin.
Result as below, looks sophisticated but from simple methodology.

Lesson 3: Scaling up is hard & failure is common

Growth can’t be forever as it will slows. Using public data, an analysis on IPO companies (where their growth is usually at peak) shows that they converge to the industry average as years goes by (even and especially as revenue continues to grow).
Median growth period is actually 3-5 years, when a projection period of 10 years, is actually an outlier.
The outliers are usually the exceptional stock which if we are valuing them as prof said, it defeats the purpose as we are already providing them with the best case scenarios (on using a 10 year growth period).
Always check agaisnt the market size so that the company won’t become the market as it grows!
Lesson 4: Don’t forget to pay for growth

From the table above, prof calculated the investment needed per year for growth over the next year using the sales/cap ratio as earlier explained. These investment accumulates every year as it forms the base to continue generate more revenue.
Using the EBIT (1-t) computed earlier, the imputed Return on Invested Capital is calculated with the terminal year of ~20%.
Median ROIC was 17% for retailerds but prof is OK with a 20% given that it has a moat.
This is a sense check in ensuring the ROIC is not way too far off & hence the growth is not way too far off either.
Lesson 5: Dilution is taken care off
The outstanding shares of young growth companies will increase over time, either as a form of payment in cash raising or through acquisitions of other companies.
Many of such companies also uses shares as options for employee retention. They can’t pay high salaries in attracting top talents, so they uses future value of their company in exchange of current cash compensation.
Both of the above effects are already reflected in value per share valuation that we do today, eventhough we are using the current number of outstanding shares. Why?
Because dilution is indirectly reflected in the negative FCF in the early years. These negative FCF have to be funded somehow right? Hence the logic.
In prof’s Amazon example, the NPV of the 1st 6 years of negative FCF totals to US$3b, which forms 16% of the end equity value computed. This implies the dilution of 16% is already incorporated.
Lesson 6: If you are worried about failure, incorporate into value
This is a lesson prof really learned as he didn’t incorporate this into Amazon’s valuation in January 2000, the dot-com bubble peaks in March 2000 which losses 3/4 of value in subseqent 2 years.
Prof has been researching what # of a failure rate % should be as it’s hard to justify. The following chart was obtain from dept of labour on studying the startup industry.

Following is the average failure rate of all sectors:
Year 1: 80%
Year 2: 65%
Year 3: ~50%
Year 4: ~40%
Year 5: ~35%
Year 6 - Year 7: ~30%
Failure rate is also affected by size of the young company, the more funded it is, the lower the failure rate or at least the failure is delayed by longer.
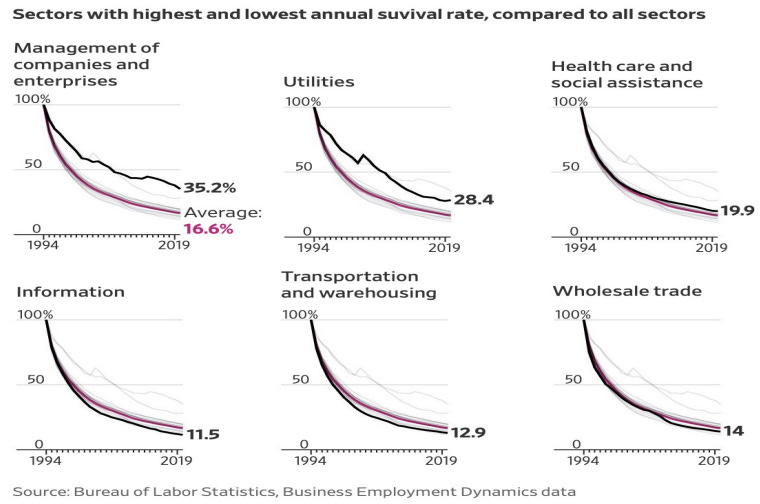
With an updated number in 2019 from chart above, the failure rate even declines further to 16.6%. No better time to start a business!
Failure risk can also relate to nationalisation risk in frontier countries & not necessarily an isolated business risk.
Lesson 7: There are always scenarios where the market price can be justified
Recap that the intrinsic value of Amazon as valued by prof was $35 & the market price at that time was $84.
Is there a possibility that the intrinsic value is actually $84? Yes, of course, by using a sensitivity table just by changing the input assumptions. (Sarcasm but is true)
Lesson 8: You will be wrong 100% of the time & is really not your fault
Just to repeat, we don’t have to be right 100% of the time, but just less wrong compared to others. No matter how careful the inputs are, news & information changes in real time which would affect the business value.
Changes to the model is a norm rather than sticking to 1 number throughout. An unbiased valuation would mean valuation changes up & down. The market is often more wrong which is what makes valuation interesting.
// end of Class 14 Valuation
Thank you for writing. I eagerly look forward to your writings on sir aswath’s classes