Class 11 Valuation: Terminal Value Closure & First Steps on Loose Ends
Terminal, growth & ROIC are all linked. But what to do with all that cash?
To recap, why is it wrong to use an exit multiple to estimate terminal value in calculating intrinsic valuation?
Pricing & intrinsic valuation do not match.
If want to use pricing, just use a forward pricing to get the valuation. Simple. This removes all the argument & late nights that 1 would experience while doing DCF. Don’t be a DCF-drag (queen) as prof says it.
Quick test:
What is the terminal value for a firm with a $100m in after-tax operating income? No growth expected in perpetuity. Cost of capital is 10%.
Since there’s no growth, means there’s no terminal value!
The value of this company is simply $100m/10% = $1,000m
What if there’s a 2% growth?
$100m/(10%-2%) = $1,250m; translates to an additional $250m in value!
1 more thing, your growth rate cannot be more than the economy, with a few exceptions of course (e.g. MSFT, AAPL, etc) but not the rule.
By assuming high growth like the greatest company of all time, then there’s no need to value at all!
Remember, the higher the growth rate the most justification you need to give in terms of competitive advantage. Not only how much, but also for how long. Assumptions, upon assumptions & assumptions.
Don’t nudge it up even by a little to justify because a little 0.25% can be another 0.25% more.
How about negative Rfr? Let’s simulate.
A negative Rfr signals a deflationary economy, which means growth rate will be very low, to a minus growth rate in perpetuity.
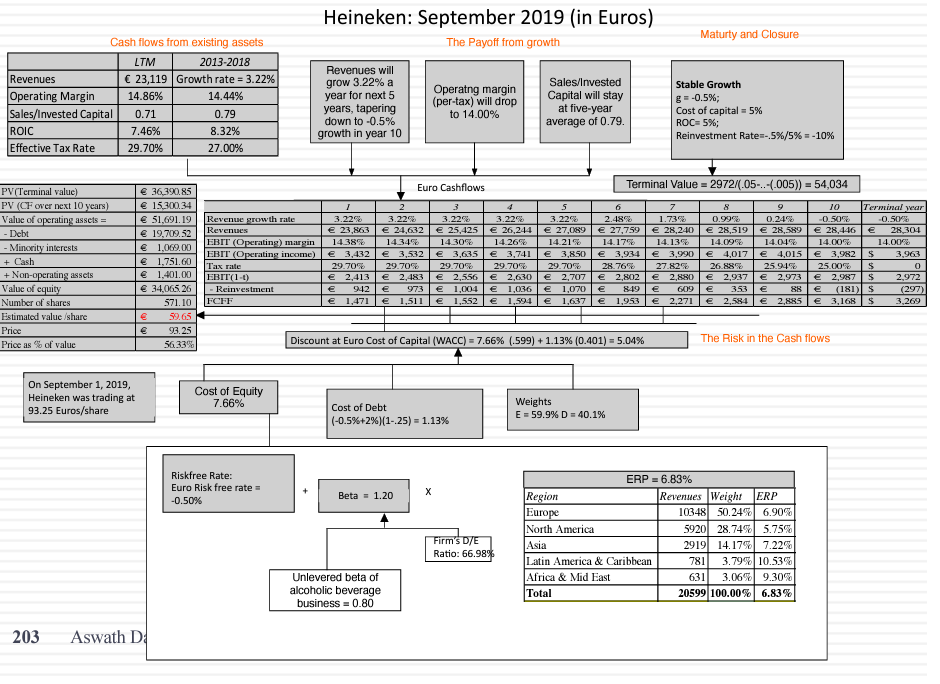
From the very busy chart above using Heineken as an example. First focus on the bottom box, where Rfr was -0.5% that eventually derived a WACC of 5.04% that is very low. This is important to note, even with negative Rfr, Cost of Capital need not be negative as well due to (high) Cost of Equity.
However, cash flow growth will also be low because of the fact that negative Rfr is needed to boost up a deflationary economy. This is shown in the top box where Revenue is grown at 3.22% for 1st 5 years & tapering down to -0.5% in year-10 & perpetuity.
Don’t be surprised, as prof said what 1 hand gives (negative Rfr), the other hand will take away (low to negative growth rate).
The end result is a value of EUR59.65, significantly lower than the share price of EUR93.25, i.e. current share price is overvalued. P.S. Pandemic hit few months later where Heineken’s share dropped to only ~EUR70.
In contrast, if we are to value a highly inflationary environment, valuation won’t implode because the growth rate will be high too.
That’s it about Terminal Value, don’t think too much about it as long as you are staying consistent.
How long will high growth last?
For a lot of companies, high growth fades quickly because of low barriers of entry.
Groupon is a classic example, what’s their competitive advantage? Getting our emails first compared to the rest? They don’t deserve to have a 10-year growth.
You can have a strong & sustainable competitive advantage through a brand name. Technology is strong, but unsustainable as everyone at the top is 1 technology away from being a Kodak, Nokia or Blackberry.
Is not growth per se, but also if the growth can generate a ROIC that is higher than WACC. This is also a competitive advantage.
How do you grow forever at terminal?
This is where the sustainable growth formula has to hold.
To recap on the formula, that a sustainable growth = Reinvestment rate x ROIC
Prof has simulated a very useful table below to answer what is the Terminal Value given Growth & ROIC. It’s assumed the Cost of capital is 10%.
1 interesting note is that if growth rate is 0%, no matter how much the ROIC is, the TV remains the same throughout.
Next, any Return on Capital that is below the Cost of Capital, the TV is below $1000 no matter how much they grow forever.
McKinsey for e.g. holds that ROIC = WACC for mature companies, they can’t get returns more than their WACC, i.e. no excess return. This means the growth rate has no effect on the TV.
ROIC is actually very sticky as done by a McKinsey’s research but whichever, do it when you are confident that ROIC > WACC.
Automobile for example, you would expect ROIC (~5%) to be less than WACC (~10%).
This is prof’s datasheet on sectors ROIC & WACC that he uses to track. Highly insightful.
The sleight of hand in DCF
Assume the following scenario. In a stable company, it’s been told that they only need to have maintenance capex (replace existing old assets with new assets) to deliver growth. There’s no capex needed & no working capital investment needed as well.
With the above, it is expected the company will grow at 2% forever or at inflation rate.
Question: Should assets that we replaced be also inflation adjusted too? Definitely. This means your capex is at least 2% higher every year. Bottom line is, even if you assume growth at inflation rate at top-line, the capex should reflect the same.
This is where the need to apply a reinvestment rate still makes sense. If there’s growth to be assumed, there must be a reinvestment rate, doesn’t matter if company is stable mature.
The Boring Company
When a company becomes mature, it becomes boring. They tend to reach “average” benchmark measurement. i.e. Beta of close to 1, debt ratio that is close to industry average and eventually a discount rate that is declining too!
It makes sense to have a high cost of capital when company is at startup stage, hence the inverse should be true.
A mature company shouldn’t have a startup discount rate. i.e Tesla in Year 1 is different with Tesla in Year 11, applies the discount rate accordingly.
To Recap
By this stage, we should know the following:
Estimating free cash flow, either to the firm or to the equity holders. Remember how a steady debt ratio means is more intuitive to project free cash flow to equity. This is the preferred way since we’re all equity investors interested to know the value to us. For fluctuating debt ratio companies, using FCFF is better.
Note that 90% of valuation done is firm’s valuation due to lesser assumptions used in cash flow around debt of repayment and raising that are hard to estimate.
Discount rate, either Ke or WACC should match back to FCFE or FCFF. Dividend discount is a form of FCFE when FCFE itself is hard to estimate because you can’t estimate capex or working capital changes for a bank, for eg. Currency to use should match back to the country chosen for risk free rate.
Always use nominal rate & cash flow in low inflation environment because taxes are based on nominal income. In high inflation environment, use real cash flow.
Stable Growth vs 2-stage & 3-stage. There’s no terminal value for a stable growth company. For high growth, we can break them down into either 2-stage or 3-stage. In the case of Snowflake, the first 3 years can be 50% then 30% declining to 10% in following years and to the inflation rate at tail end.
We always want to use the most pragmatic method to reduce friction & assumptions.
After knowing how to do DCF with all the above, let’s see what kind of damage it can do with adding premiums & discounts here, there & everywhere!
Loose end 1: Cash (& marketable securities)
We don’t touch it during valuation as FCFF is derived from Operating Assets (without cash). Only after that we add back the cash.
Let’s simulate if we should discount or add a premium to cash:
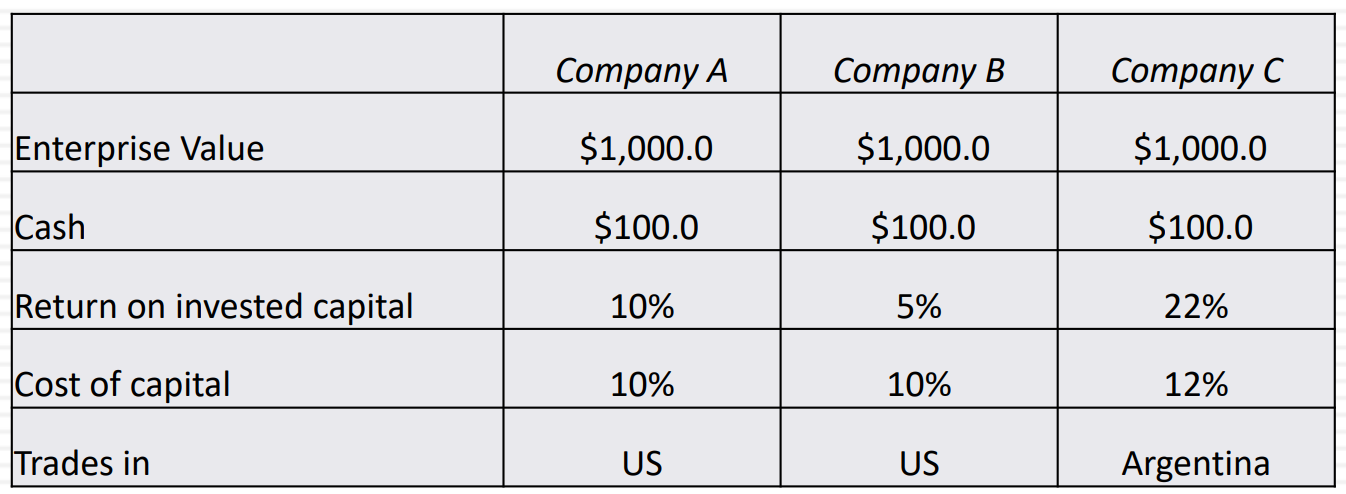
In the 3 companies above, which cash has:
A neutral value (equals to $100)
A higher value (worth more than $100)
A lower value (worth less than $100)
Company A’s cash has a neutral value since the cash is indifferent to having it being invested for 10% ROIC where the cost of capital is only 10%. There’s no excess return to earn.
Company B is a stupid company. With Cost of Capital at 10%, they can only generate 5% of ROIC.
Company C’s cash has the highest value as it is able to earn 22% on top of it’s 10% cost. Given that it is located in Argentina, having a cash balance becomes a strategic asset for acquisition.
The above example can used in other forms. i.e. big companies vs small companies, public companies vs private companies, etc.
The same amount of cash has different value to different companies.
Hence, by having a broad stroke of discounting cash because it does nothing is not valid.
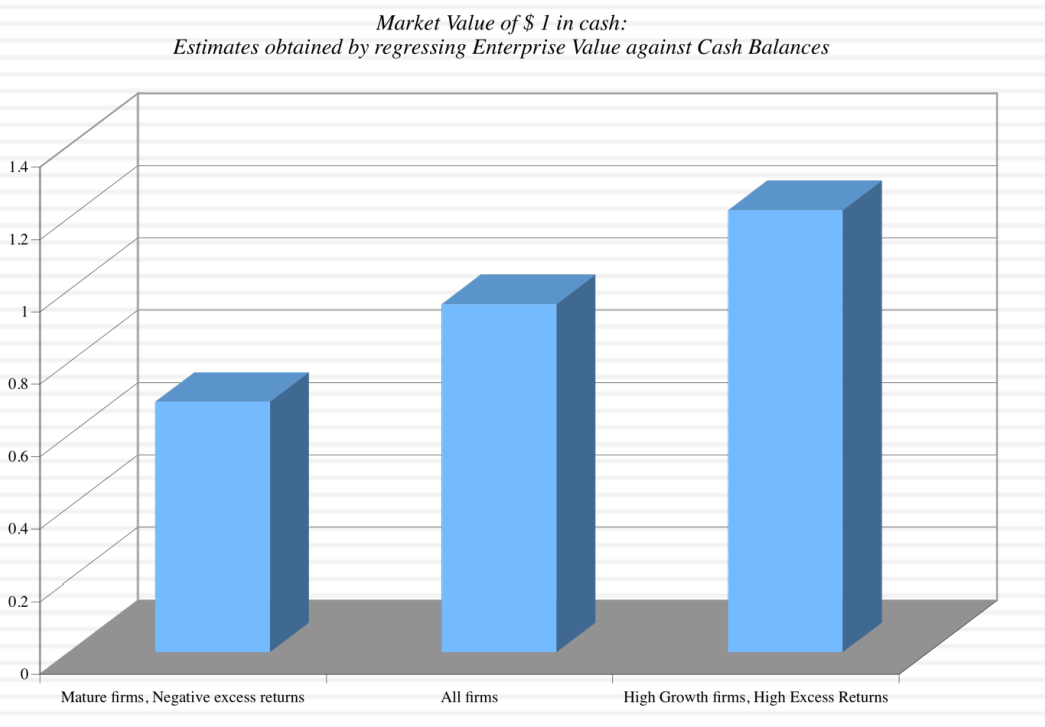
The market does reward & penalise cash balance actually in practice. Below is academic research done on how a $1 is valued by the market.
$1 is only worth $0.69 for most mature companies, meaning cash is destroying the firm’s value. Hence, this is why active investors in such cases always push for a dividend to extract the cash out. The cash is more useful if is given back to the investors. This immediately provide a 44% ($1/$0.69) increase in company’s value!
Why is there a premium of cash to high growth companies? High growth means high risk of failure. By having more cash in the company, it allows the company to survive longer. This is the reason why tech startups pop during IPO. This event dramatically changed the risk profile of the company to be less risky, due to an influx of cash.
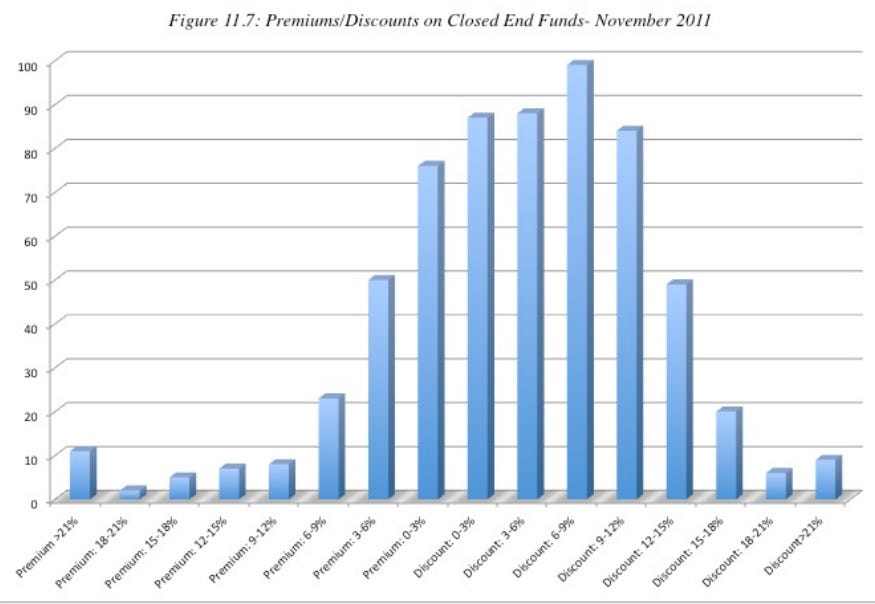
Perhaps a better illustration is on close-end fund:
A close-end fund is a public listed vehicle with the underlying assets as all the stocks the fund owns. If you are to add up all the underlying stocks value, the sum will always be higher than the traded price of the close end fund. Hence, that why you always read about close-end funds always being discounted and is primed for a takeover. Not this case though.
This “discount” is a feature of the close end fund. In the history of fund management business, they always underperform the index 95% of the time. Hence, this underperformance reflects directly in the share price of the close end fund! Sounds ridiculous but it’s true.
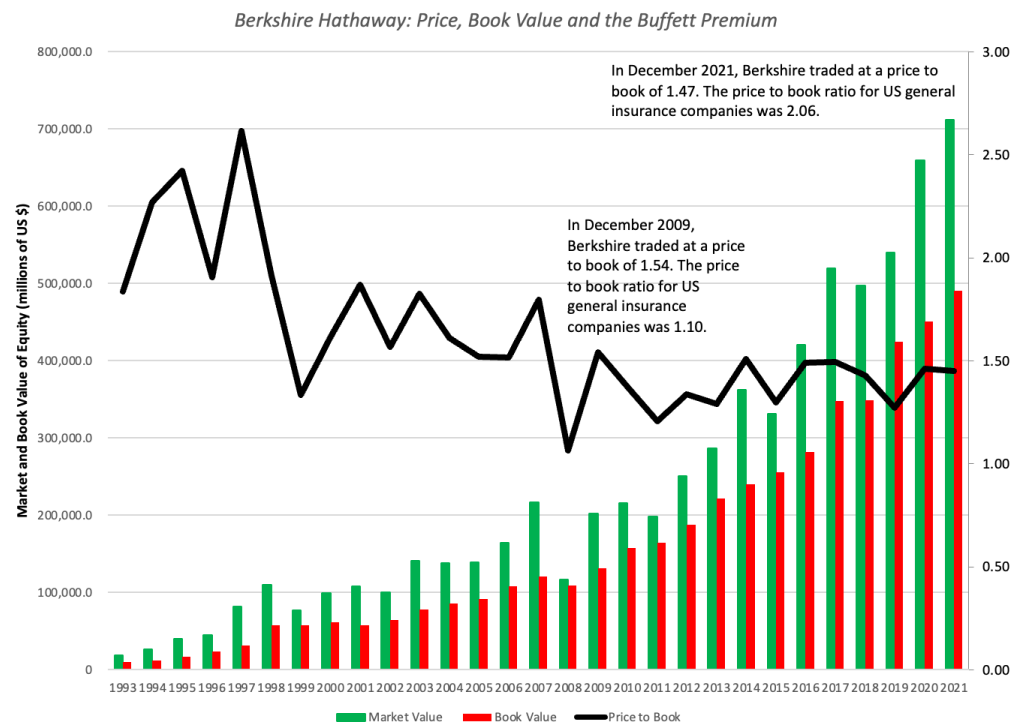
Let’s flip it. There’s 1 interesting close-end fund example with a premium to showcase, i.e. Berkshire Hathaway.
Notice that the Market Value (in green) is always higher than the Book Value (in red). Berkshire owns Coca-cola, this means investors in Berkshire is willing to pay 1 to 2x more to own Coca-cola via Berkshire. This went as high as 2.7x in the late 90s.
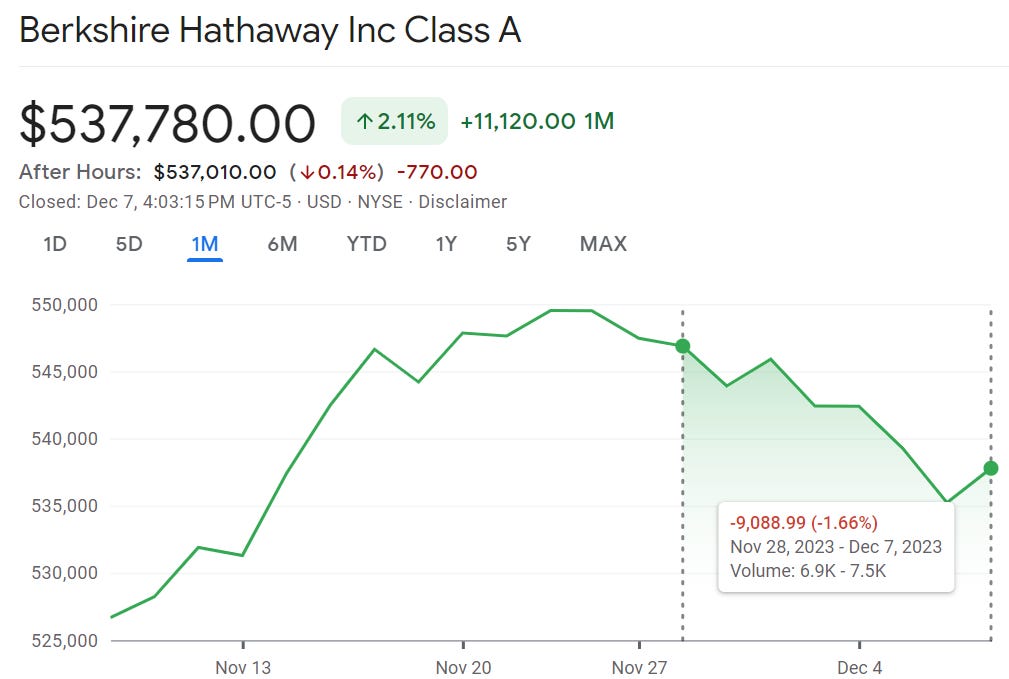
Notice how this premium is declining to 1.5x in recent years. It can be explained by Berkshire’s share price for past 8 days since Nov 28 as it has declined by 1.66%, or US$13b of market cap loss.
The reason is key men risk. As both Warren & Charlie age, the premium assigned to them declines. 1.5x p/book has sustained for about a decade now until just recently that it dropped to 1.47x.
Loose end 2: Cross holdings
There are 3 types of cross holdings.
Minority passive - you own less than 10% of the company & have no board seats to influence the company
Minority active - same holdings as above but with board seats
Majority active - you own more than 50% of voting rights in the company
For minority passive, the accounting treatment is to only recognise the cost of the investment in balance sheet, and dividends in the P&L. Softbank in the early days has 50% of its value in Yahoo but when you look at the P&L, it shows nothing to reflect it since there’s no dividend.
For minority active, accountants will treat it as an associate company and hence the the true value of the company will be reflected in balance sheet based on your % holding; similar to an “updated book value.”
Majority active cross holding is where accountants flip out by consolidating. If you own 60%, you have to account for 100% of it. The difference is shown as minority interest or non-consolidated interest, shown at the liability section.
Also, different companies have different policies, some classify their minority stake as “available for sale” while some classify as “held to maturity”. First step in evaluating is to actually read through the notes in the annual report.
So, in a perfect world for valuation purpose. We break things down.
Our first step is to value the holding company as standalone. Meaning ignore the consolidate numbers & only value the holding company alone, taking into account the net debt positions.
Next is to value the individual subsidiary companies individually, taking into account the net debt positions.
The final value will therefore be holdingCo value + % of each subsidiary value.
It’s difficult. As you need to have the financials for each of the subsidiaries, and as well as the holding company. Not all information is disclosed. Imagine a Japanese conglomerate that has 200+ subsidiaries!
Back to Yahoo, which owns Alibaba as an investment back in 2013. Prof decided to do an intrinsic value of Yahoo as he has all the information needed. Yahoo itself being US listed, it’s 35% associate of Yahoo Japan is also listed in Japan & Alibaba has just filed for an IPO.
By breaking them down & summing it back up, Prof’s intrinsic value on Yahoo was $41 billion or $41/share (Yahoo as standalone @ $7.3b + 35% of Yahoo Japan @ $7.3b + 22% of Alibaba @ US$32b.)
Fun fact: Verizon acquired Yahoo’s standalone business for only $4.8b in 2016, way lower than the $7.3b just 3 years back. In between the 3 years, they acquired Tumbler for $1.1b which is nowhere to be seen today.
There’s 1 shortcut that go against prof’s consistency rule given that we don’t always have full information of the investees.
We derive the market value of the minority interest via a price/book multiple of the sector the company is in. Then, we subtract out this minority interest value from our valuation of the consolidated company.
Using the same Yahoo example, prof uses a EV/Sales multiple to demonstrate the same.
Next class we’ll tie up all loose end & start to learn the fun parts of storytelling!
// end of Class 11 Valuation


